Load testing reporting with New Relic APM.
A load test tells you when and how much your site slows down. Application performance monitoring tells you where inside the application it happens. When your team runs New Relic APM, we fold its data into the engagement report so the bottleneck has a name, not just a timestamp.
Two views of the same slowdown.

Our load test drives the traffic and records exactly when response time degrades and at what user level. New Relic APM watches the application from the inside during that same test. Read side by side, the two answer different halves of the question: the load test says the site slowed down at this concurrency, and the APM data says this is the part of the application that caused it.
What the APM data adds to the report.
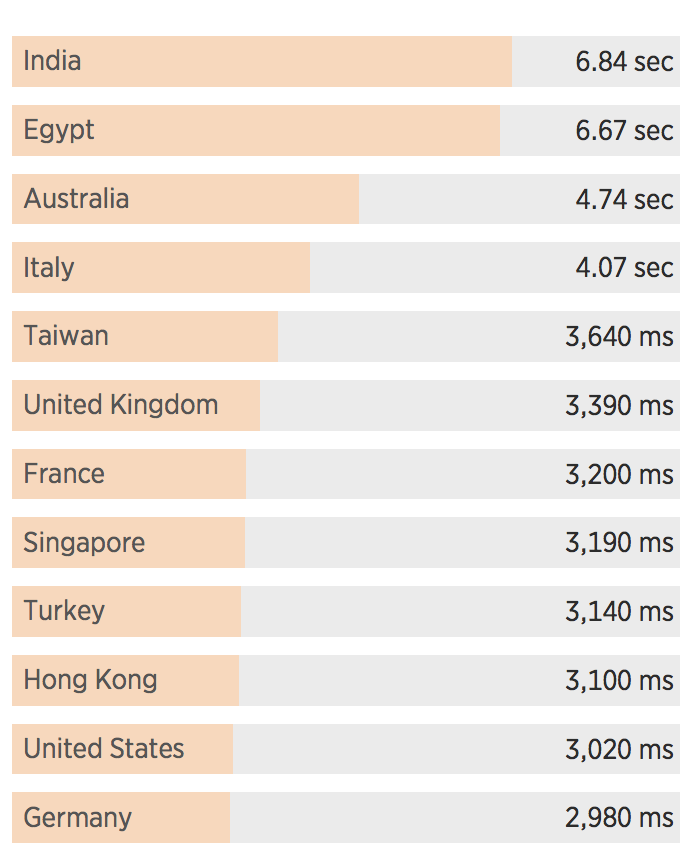
Geographical differences
User location changes real-world speed. The data helps you make better decisions about where to deploy servers.
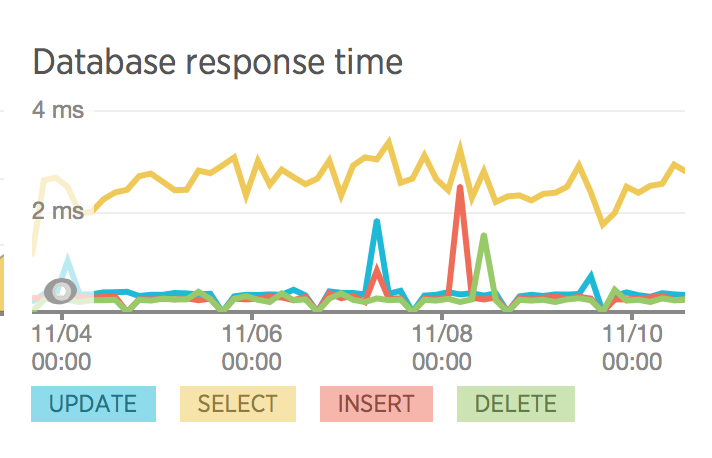
Database performance
Slow-query and database breakdowns show how your data layer holds up as concurrency climbs, which is where load-test slowdowns so often start.
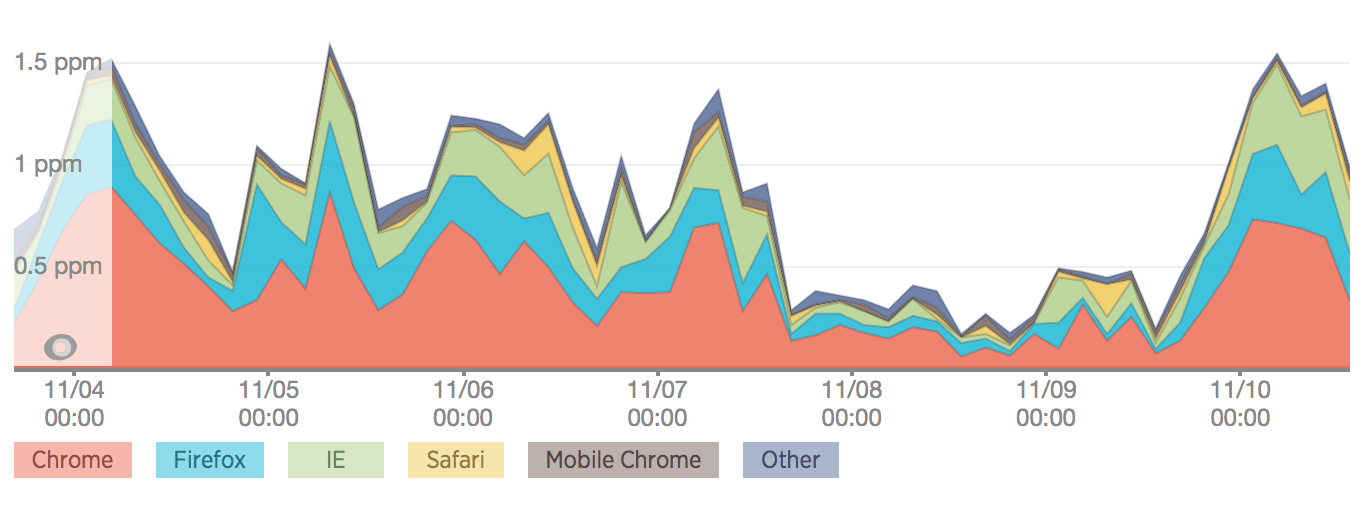
Browser rendering speed
Front-end timing separates server slowdowns from rendering ones, so you can prioritize the fixes that actually move the user-facing number.
Turn a load test into a report that names the bottleneck.
Tell us about your stack and your monitoring. We will scope an engagement that pairs the load test with your APM data and closes with an engineer-written analysis of what to fix.
Get web performance news
Occasional load-testing tips, performance-engineering notes, and product updates. No spam — unsubscribe anytime.